


LOTTO Analysis

Descrição de LOTTO Analysis
Lotto draws historical and current, frequency and delays, graphics.
LOT Analysis allows you to easily view all the lottery since 2001 showing the numbers more frequent and ritardari of each wheel, in sortable tables or graphs.
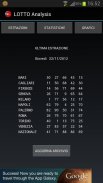
Main screen:
Shows the numbers of last withdrawal on all wheels, the UPDATE button is used to update ARCHIVE extractions from the internet, the extractions button to switch to the screen of the previous draws, the STATISTICS button to switch to the screen of numbers and frequent latecomers and GRAPH button to switch to the charts.
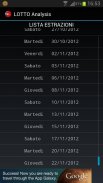
LIST screen extractions:
And 'possible to scroll through the list of draws since 2001 (click and drag the blue slider to the right to scroll through the list more quickly) and clicking on a row to go to the screen of the single extraction.
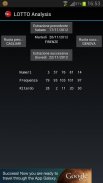
Screen EXTRACTION:
Numbers are shown above the extraction choice, plus the frequency and the delay that had any number at the time of extraction (to see if a certain day were extracted numbers or frequent ritardari).
The 4 buttons are arranged in a cross to go directly to the next or previous extraction, and the wheel up or down.
Screen STATISTICS:
Menu to access FREQUENT NUMBERS AND laggards, the ENVI ENVI RESEARCH AND FREQUENT and TERNI.
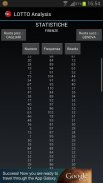
Screen FREQUENT NUMBERS AND laggards:
And 'table shows the numbers of more frequent and laggards, with the top two buttons to move the wheel up or down.
To sort the table according to the number, frequency or delay, press the respective buttons NUMBER FREQUENCY or DELAY.
Screen ENVI FREQUENT:
Select the wheel and press the Search button to search for ambi out more frequently; are shown the pair of numbers and the number of outputs.
Screen RESEARCH AND AMBI TERNI:
Used to search for and ambi terni out on a wheel containing the desired number; select the wheel, enter the desired number and press the SEARCH button.
Screen GRAPHICS:
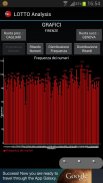
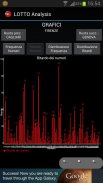
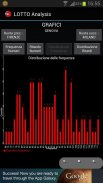
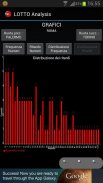
The top two buttons are used to select the wheel, the 4 buttons below to choose the 4 types of graphs available.
In the first type (RATE NUMBERS) shows the frequency of each number drawn.
In the second (DELAY NUMBERS) shows the delay of each number drawn.
In the third (FREQUENCY DISTRIBUTION) shows the amount of numbers with a certain frequency.
In the fourth (DISTRIBUTION DELAYS) shows the amount of numbers with a lag.
E 'can enlarge each graph using the buttons below, or widen it and move it by dragging your fingers on the screen.
Note:
The Internet connection is only used to update the archive and for advertising.
Once you update the file, you can use all offline.
For graphics we used the open source library AChartEngine:
http://www.achartengine.org/
For any problem or idea please contact me freely by email :-)
vascottod@gmail.com


